

Live Response is a new feature in Microsoft Defender Advanced Threat Protection (ATP). Live Response gives you instantaneous access to a machine using a remote shell connection. The direct shell connection allows you to investigate and take immediate response actions in real time.
Per Microsoft – Live response allows running four types of commands:
- Run basic and advanced commands to do investigative work.
- Download files such as malware samples and outcomes of PowerShell scripts.
- Run remediation / undo remediation commands.
- Upload a PowerShell script or executable file to a library and run it on the machine from a
tenant level.
Lets now walk through enabling the new feature, connecting to a device to run basic commands for investigative work, and finish with discussing a forensic capture of the system memory.
Prerequisites:
Windows 10 version 18323 (also known as Windows 10 19H1) or later.
Must have Role Based Access Control enabled.
Enable Role Based Access Control (RBAC) in Defender ATP:
Login to Microsoft Defender ATP.
Select Settings > Roles > Turn on roles.
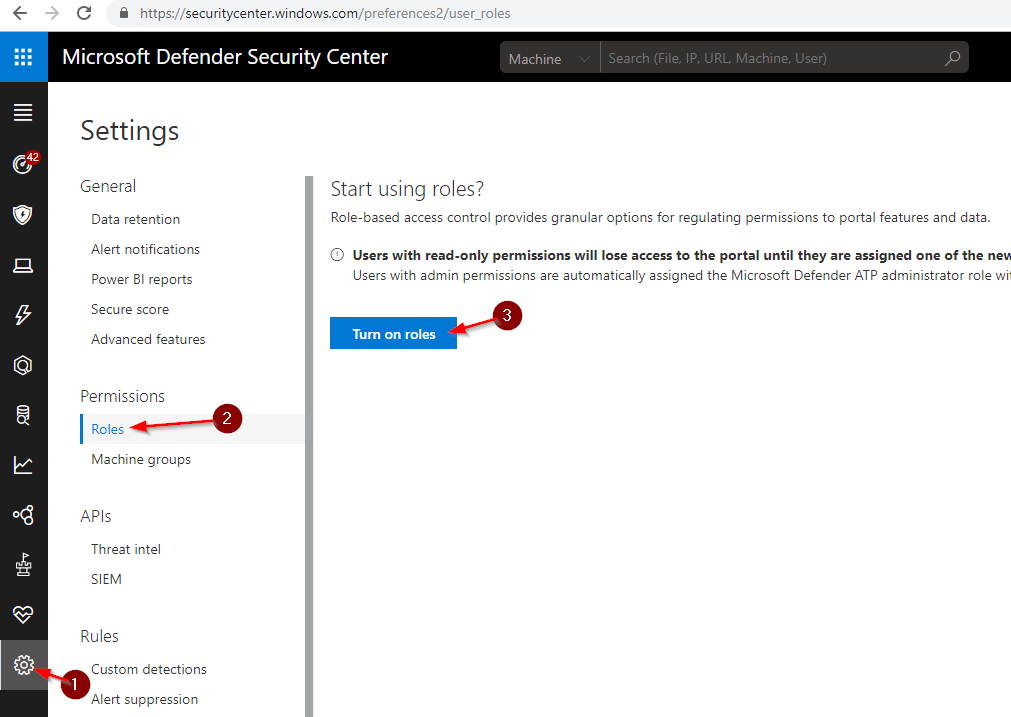
Once enabled add any users to the Microsoft Defender ATP administrator (default) group that will be using Live Response.

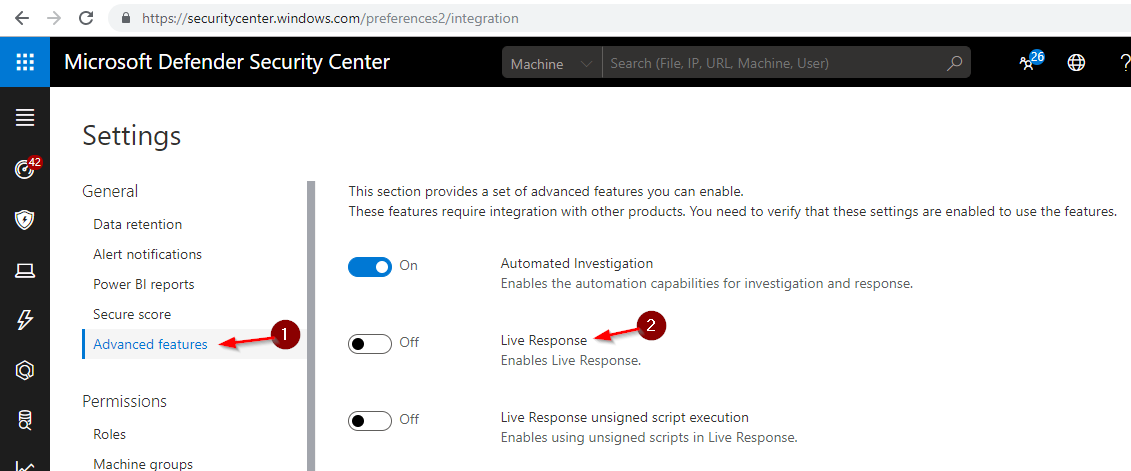
Enable Live Response:
While in Settings select Advanced features and turn On Live Response.
Note: you can also enable Live Response Unsigned Script Execution if you plan to run unsigned scripts. This feature can potentially expose you to threats.
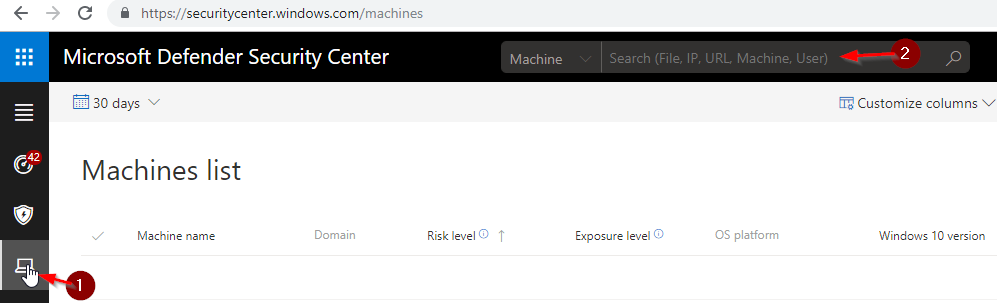
Initiate a Live Response Session:
Select Machines List or search for Machine at the top of the Microsoft Defender Security Center.
Select your Machine and click Initiate Live Response Session.
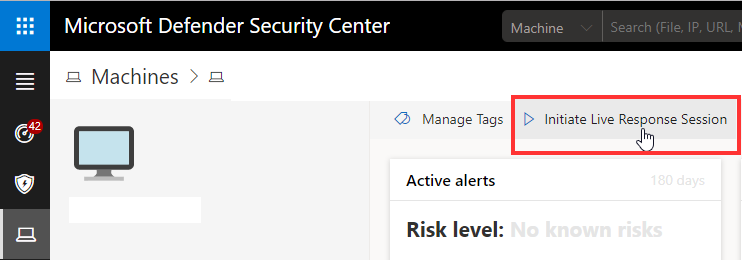
This will open a console session.
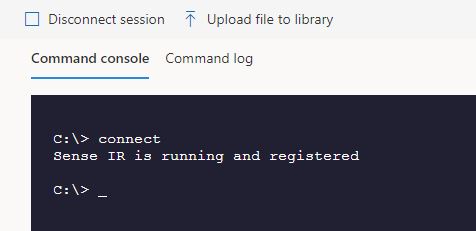
Help will give the list of commands:
analyze – Analyzes the entity for threats and returns a verdict (malicious, clean, suspicious)
cd – Changes the current folder
cls – Clears the console screen
connect – Establishes connection with the machine for the live response session
connections – Shows all active connections
dir – Shows the list of files and sub-folders in a folder
drivers – Shows all drivers installed on the machine
fileinfo – Shows information about a file
findfile – Locates files with a given name on the machine
getfile – Downloads a file from the machine
help – Shows information about live response commands
library Lists or takes action on files in the live response library
persistence – Shows all known persistence methods on the machine
processes – Shows all processes running on the machine
putfile – Uploads a file from the library to a temporary working folder on the machine
registry – Shows information about specific keys or values in the registry
remediate – Remediates an entity on the machine. The remediation action taken will vary depending on the type of entity
run – Runs a PowerShell script from the library on the machine
scheduledtasks – Shows all scheduled tasks on the machine
services – Shows all the services on the machine
trace – Sets logging on this console to debug mode
undo – Restores an entity that was remediated
Run a Forensics Memory Dump Capture:
The new Live Response session also allows for running a forensics capture tool such as sysinternals or dumpit.
Example using Dumpit, download the Dumpit Application.
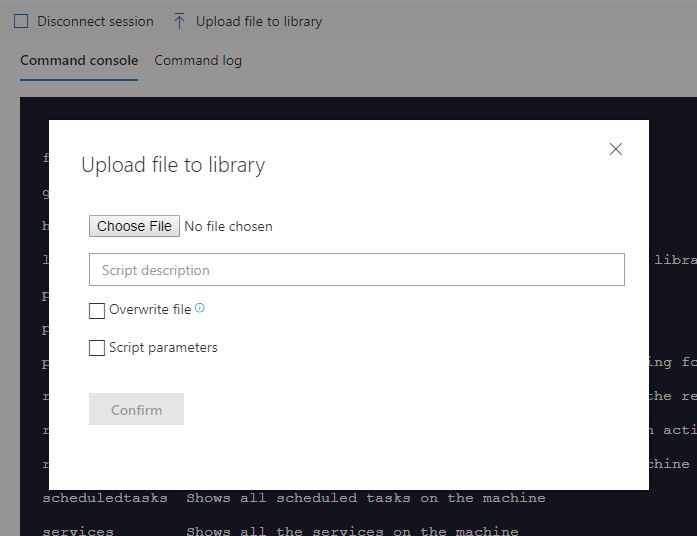
Extract the executable and then once in a Live Response session, click Upload file to library.
Run the command:
putfile dumpit.exe
Next run the command:
Run dumpit.exe
Note: this will create a Raw Memory file and need a tool such as Volitility to analyze. You can utilize the Getfile command above.


